
Your pipeline report looks healthy at first glance. More opportunities are in play, the forecast is fuller, and the team is talking about “momentum,” yet revenue still lands in the same place quarter after quarter. That's the moment sales velocity stops being a formula on a slide and becomes a governance problem, because the core question isn't how busy the team feels, it's how much revenue it's generating for every day of selling time.
Sales velocity gives you a single revenue rate by combining qualified opportunities, average deal size, win rate, and sales cycle length into one number, then forcing you to ask which lever is moving. The power of the metric is that it compounds inputs, so a change in any one lever can matter a lot. A shorter cycle matters too, because when opportunities, deal size, and win rate stay constant, cutting cycle length from 90 to 60 days lifts velocity by 50% since time sits in the denominator. That makes the metric useful for managers who need to know whether growth is coming from more pipeline, better conversion, bigger deals, or faster progression, not just more closed-won logos.
Table of Contents
- Why Sales Velocity Exists and What It Actually Measures
- The Four Levers Inside the Sales Velocity Formula
- Worked Calculations and the Multiplicative Effect
- Building a Sales Velocity Spreadsheet or CRM Dashboard
- Benchmarks by Company Size and Common Measurement Mistakes
- Adapting the Formula for WhatsApp and Messaging-Led Funnels
- Your 30-60-90 Day Plan to Increase Sales Velocity
Why Sales Velocity Exists and What It Actually Measures
The first time a revenue leader really feels the need for sales velocity is usually after a painful Monday meeting. The team has more opportunities than last month, the pipeline slide looks bigger, the forecast has more names in it, and still the quarter is flat. That mismatch is exactly why the metric exists, to turn activity into a time-based revenue rate that answers a practical question, how much money are we generating per day of selling effort?
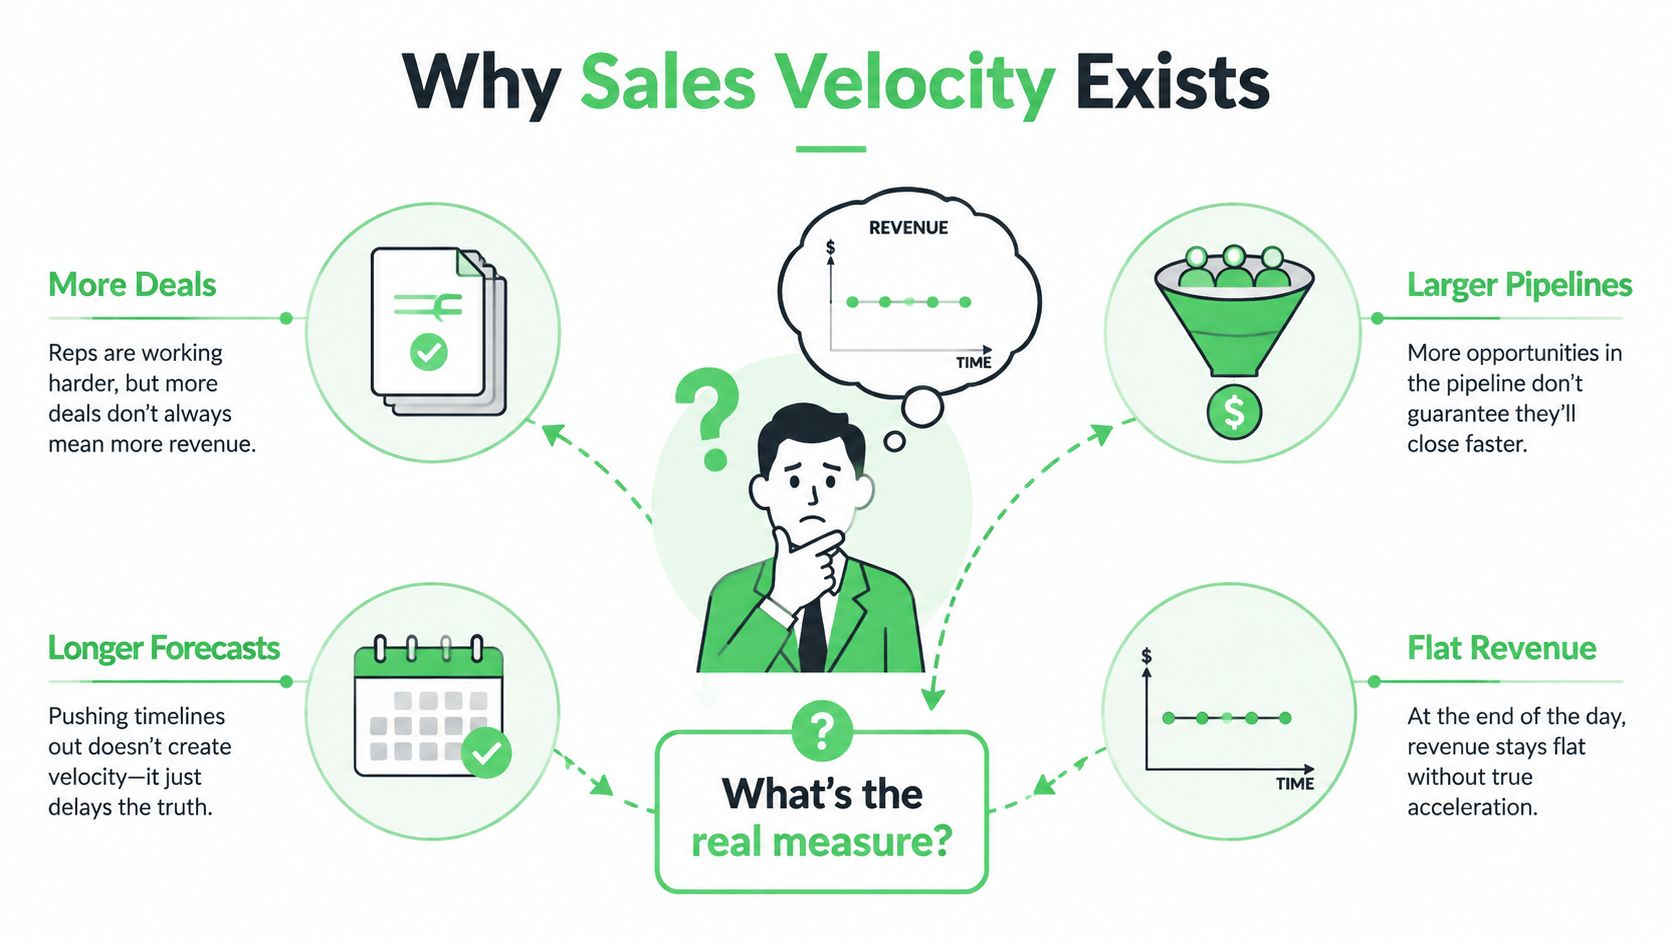
Sales velocity is best understood as a diagnostic, not a trophy. It doesn't tell you whether the team is “good” in some abstract sense, it tells you whether the revenue machine is producing faster or slower than before. That's why it's strongest when you compare the same team against its own prior performance, or compare one segment against another inside the same business.
Practical rule: If the number moves, ask which lever changed before you celebrate. A higher velocity can come from real selling improvement, or from a narrower definition of opportunity that made the data look cleaner.
The four branches of the metric work together because the formula is multiplicative. More opportunities help, but only if they're qualified. Bigger deals help, but only if they still close. A better win rate helps, but only if the cycle doesn't stretch so far that the gain gets diluted. That's why this metric deserves operational ownership, not just a spot in a forecast deck.
The Four Levers Inside the Sales Velocity Formula
A sales velocity review starts with the four parts of the formula, because each one answers a different governance question. How many real opportunities are in play, how much value is attached to each one, how often they turn into wins, and how long they take to move through the funnel. Read them in that order, and the metric becomes easier to control.
Qualified opportunities are the count of real pipeline items, not raw leads or form fills. Average deal size is the typical revenue amount you win, often best measured from closed-won deals so the number reflects actual purchasing behavior. Win rate is the share of opportunities that close won. Sales cycle length is the average number of days from opportunity creation to close.
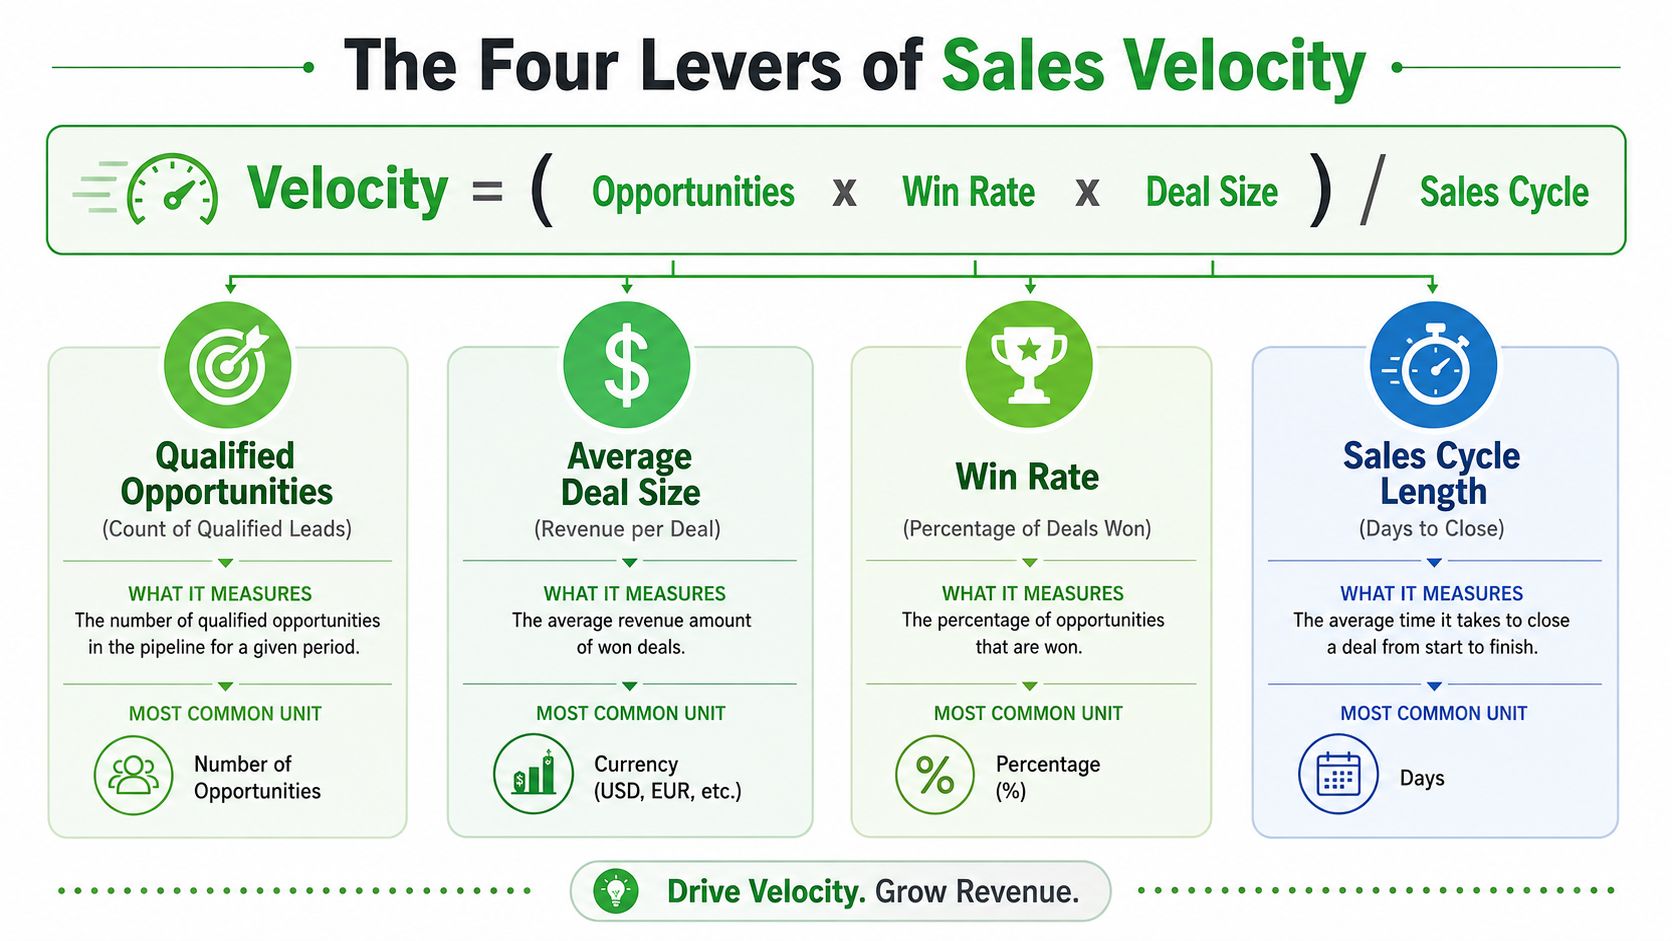
A useful way to hold the formula in your head is to compare it to a conveyor belt. The belt moves faster only when the load is real, the items are valuable, the conversion rate is healthy, and the path to the finish is not stretched out by slow handoffs. If one lever is mismeasured, the whole system looks better or worse than it really is.
Qualified Opportunities
A qualified opportunity is a lead that has already passed your team's actual qualification standard. That matters because counting everything that entered the funnel can make the pipeline look healthier than it is. In a CRM, this is usually a count, not a dollar figure, and it should be tied to a stage definition everyone uses the same way.
For a revenue operations team, this is the first control point. If sales and marketing disagree on what qualifies, the velocity number stops being a shared operating signal and turns into a discussion about stage discipline.
Average Deal Size
Deal size is the revenue value you usually see in closed-won business. If your pricing is fixed, the number is straightforward. If your pricing is bundled or variable, use the average purchase amount so you don't pretend every deal is identical when it isn't.
This lever matters because it shows how much revenue each win carries. Two teams can close the same number of opportunities and produce very different velocity if one team consistently lands larger contracts or better package mixes.
Win Rate
Win rate is the ratio of deals won to total opportunities. If a rep closes 8 out of 40 qualified opportunities, the win rate is 20%. That single percentage matters because it multiplies every qualified opportunity in the pipeline, which is why a small improvement can matter more than a shallow increase in lead volume.
For managers, win rate also tells you something about friction in the selling process. If opportunity creation is strong but close rates stay flat, the problem is usually somewhere in discovery, qualification, pricing, or proposal quality.
Sales Cycle Length
Cycle length is measured in days from opportunity creation to close. It isn't “time since first contact,” unless your CRM defines opportunity creation that way. That distinction sounds minor, but it's the sort of governance detail that changes the number enough to make two teams think they're talking about the same metric when they're not.
Shorter cycle length increases velocity because time sits in the denominator. A faster process does not need to change the size of the pipeline to improve output, it moves the same revenue-producing motion through the funnel more quickly.
Keep the definitions locked before you start optimizing. If one manager counts a deal at demo stage and another counts it at qualification, the velocity report stops being an operating tool and becomes a debate about data hygiene.
Worked Calculations and the Multiplicative Effect
The easiest way to understand the math is to run two simple scenarios. Say Team A has 40 qualified opportunities, an average deal size of $12,000, a 20% win rate, and a 60-day cycle. Their velocity is $1,600 per day using the formula. Team B has the same opportunities, deal size, and win rate, but a 90-day cycle, so their velocity drops to $1,067 per day. Same pipeline shape, different pace of conversion, different output.
One Lever Moves at a Time
Now keep Team A as the baseline and change only one variable at a time.
| Scenario | Opportunities | Deal Size | Win Rate | Cycle (days) | Velocity ($/day) |
|---|---|---|---|---|---|
| Baseline | 40 | $12,000 | 20% | 60 | $1,600 |
| More opportunities | 48 | $12,000 | 20% | 60 | $1,920 |
| Larger deal size | 40 | $13,800 | 20% | 60 | $1,840 |
| Higher win rate | 40 | $12,000 | 22% | 60 | $1,760 |
| Shorter cycle | 40 | $12,000 | 20% | 48 | $2,000 |
The table shows the core lesson. Each lever can move velocity, but the divisor has a special effect because time sits underneath the whole calculation. A faster cycle doesn't just add a little efficiency, it compresses the same revenue-producing motion into fewer days. That's why leaders who chase more top-of-funnel volume first, without checking cycle length or win rate, often overestimate what extra leads will do.
Rule of thumb: If your team is debating whether to add more leads or tighten the handoff process, do the math both ways. The lever with the bigger output change should get the first operational fix.
The multipliers also help you avoid lazy interpretations. A rep can close more deals and still post weaker velocity if those deals are small or slow. Another rep can close fewer deals and outperform if they win larger business faster. The formula forces the conversation away from vanity counts and toward revenue per day.
Building a Sales Velocity Spreadsheet or CRM Dashboard
A usable sales velocity model starts with five columns and a locked definition for each one. Build the sheet with Qualified Opportunities, Average Deal Size, Win Rate, Sales Cycle Length in Days, and Velocity. The last column is just the formula, so in Google Sheets or Excel it reads like (Opportunities * Deal Size * Win Rate) / Cycle Length, with win rate entered as a decimal or percentage according to your sheet's formatting.
What to Pull From the CRM
The cleanest way to build it is to pull opportunity counts from the qualified pipeline stage, deal size from closed-won amounts, win rate from won versus total opportunities over the same period, and cycle length from the average number of days between creation and close. Keep the date range fixed, usually monthly or quarterly, so you don't compare a partial period with a full one. If you refresh the dashboard weekly, lock the same historical window so the trend is comparable week to week.
A common build mistake is mixing weighted and unweighted averages. If one report averages deal size across all opps and another uses only won deals, the result no longer describes the same funnel. Another mistake is letting managers edit the pipeline definition mid-quarter. That makes the number look “better” without improving selling efficiency.
If you want a practical resource for improving the surrounding funnel mechanics, the 2026 funnel optimization tips from Prometheus Agency are a useful companion read because they frame optimization as a process, not a one-time tweak.
A Simple Dashboard Setup
A CRM dashboard only needs a few tiles to be useful. Put velocity at the top, then break it out by segment such as product line, region, or company size if your cycle and pricing differ. Add the underlying four levers below it so the team sees what moved the number instead of staring at the headline alone.
If your business sells more than one motion, segment the dashboard before you segment the people. One blended number often hides the core problem. A small, fast SMB motion can make an enterprise pipeline look healthy even when the enterprise motion is stuck.
Benchmarks by Company Size and Common Measurement Mistakes
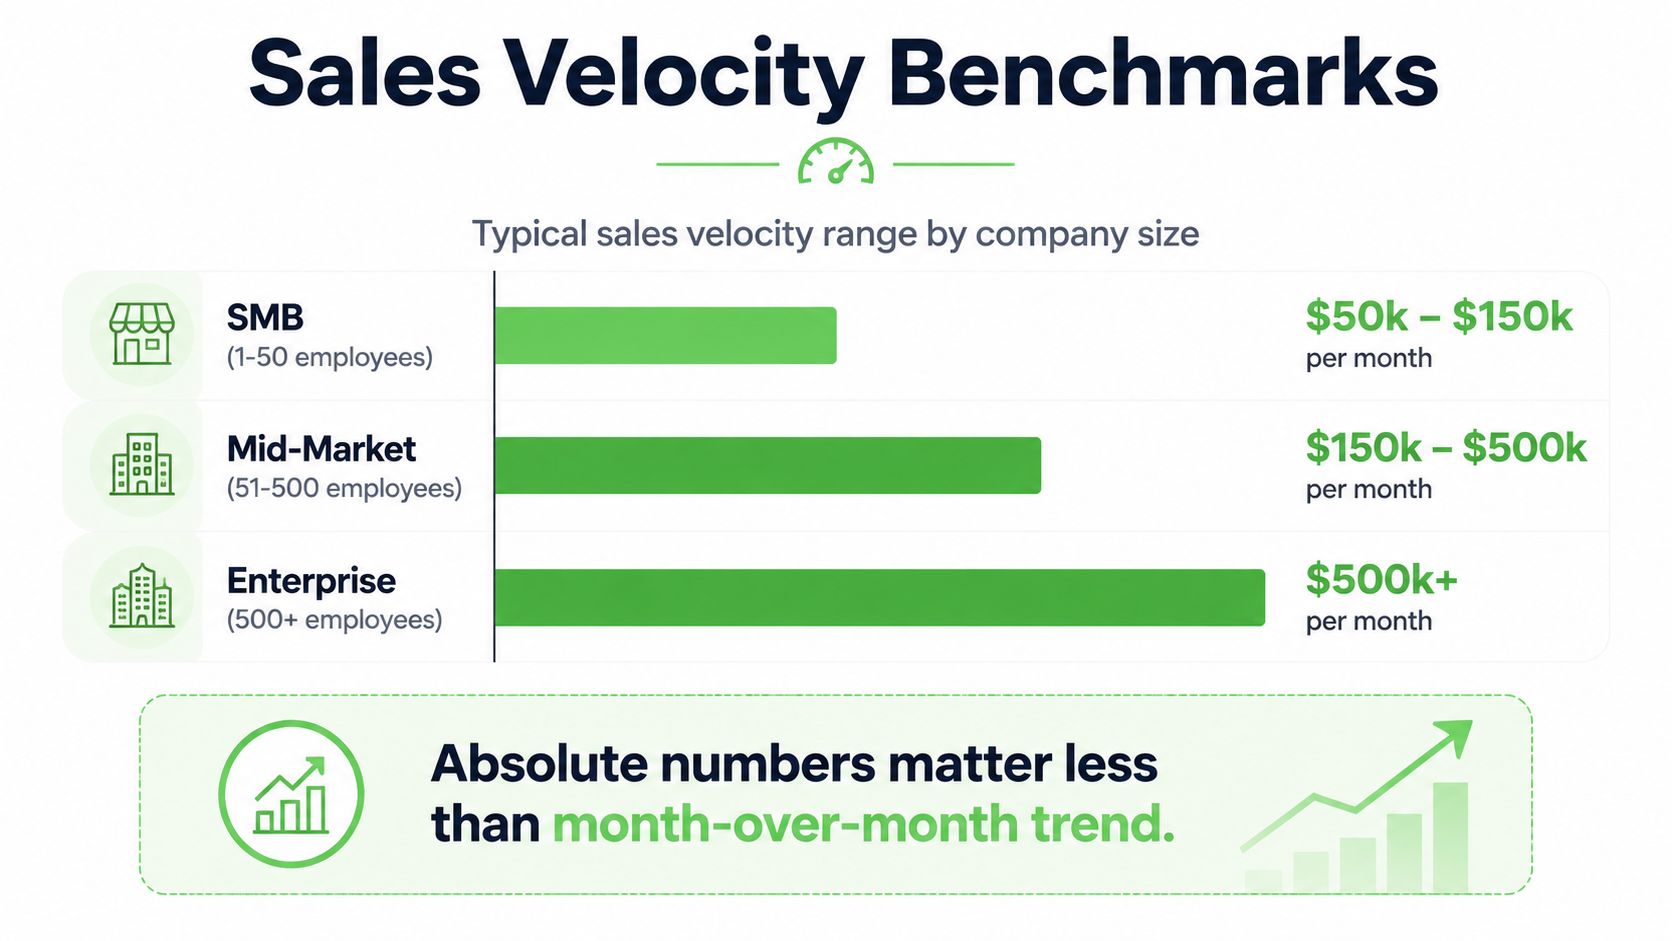
A benchmark is only useful if it helps you decide what to inspect next. For broad company-size context, many teams think in ranges rather than exact targets, with SMB often sitting around $50k to $150k per month, mid-market around $150k to $500k, and enterprise at $500k+. Those figures are directional, not universal, and the important part is not the absolute number, it's whether the metric is improving inside the same segment over time. The hierarchy also reflects a reality that larger organizations usually have more pipeline capacity and larger deals, which is why blending them into one measure can be misleading.
Where Teams Accidentally Distort the Number
The most common measurement mistake is changing the opportunity definition halfway through the quarter. If the team tightens qualification criteria, the opportunity count drops, the win rate may improve, and velocity can appear stronger even if the field team didn't get faster. Another mistake is blending self-serve deals and enterprise deals into one funnel, then acting surprised when the cycle length looks strange.
A third problem is calculating cycle length only from closed-won deals without checking what's stuck in the open pipeline. That's a useful historical lens, but it can hide the deals that are aging badly right now. When a team only measures the wins, it can miss the parts of the funnel that need coaching.
How to Keep the Metric Honest
Split velocity by segment when pricing, buyer complexity, or cycle length differs. That's the same governance logic behind advice to compare small, mid-market, and enterprise pipelines separately. If you're evaluating a funnel builder, the same principle applies, because the tool matters less than whether it preserves consistent definitions across segments. A guide to choosing the right funnel builder is useful here because it pushes readers to think about fit, not just feature lists.
Best practice: If a velocity number improves and no input changed in a believable way, audit the definitions before you brief leadership. Clean data is part of the metric, not a separate housekeeping task.
Adapting the Formula for WhatsApp and Messaging-Led Funnels
Classic sales velocity was built for email and call-heavy pipelines, where a rep works a small number of opportunities through relatively formal stages. Messaging-led funnels behave differently. In a WhatsApp-first motion, revenue often starts with micro-conversions, first replies, and conversation quality before a formal opportunity ever exists, so the four-variable model needs a fifth lens if you want it to reflect reality.
The Three Messaging Inputs That Change the Picture
The first extra lever is first-response time. The faster a team answers, the less likely a conversation goes cold before qualification. The second is conversation-to-opportunity conversion, which measures how often chats turn into real opportunities instead of casual support threads. The third is channel-specific win rate, because a deal that starts in WhatsApp may convert differently from one that starts in email or a landing page form.
These aren't replacements for the classic formula. They sit upstream of it. In practice, they tell you whether the team is creating enough qualified opportunities in the first place, and whether speed is helping or hurting the quality of those opportunities.
What Automation Changes
Messaging workflows give teams more control over the gap between first touch and qualification. Auto-welcome flows reduce response lag. Smart links and QR codes capture the conversation source before a lead disappears into a generic inbox. CRM participant sync keeps attribution attached to the contact thread so you can see where the opportunity came from.
The strategic shift is simple. In messaging-led funnels, shortening sales cycle length alone can understate performance gains because acceleration may happen before the opportunity exists. If a team moves from silent inbound to immediate conversation, that improvement should show up in the model somehow, not vanish into a generic win-rate report. That's why the modern version of sales velocity needs to think in terms of speed, conversion, and channel behavior, not just stage-to-stage motion.
Your 30-60-90 Day Plan to Increase Sales Velocity
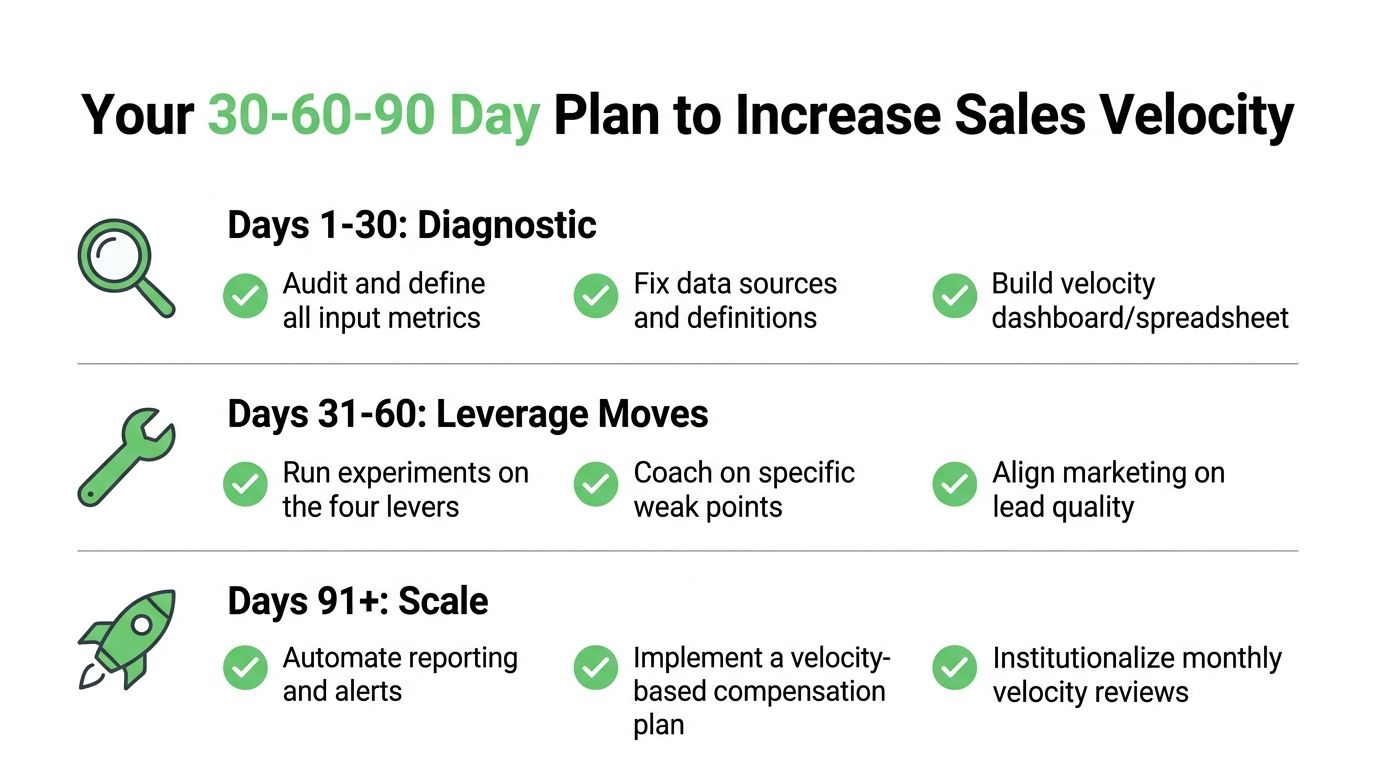
The fastest way to improve velocity is to stop treating it like a single KPI and start treating it like a system. In the first 30 days, fix the inputs. In the next 30 days, attack the weakest lever. After that, automate the motion so the gains don't disappear when someone gets busy.
Days 1 to 30
Audit and define the four inputs with the sales manager, ops lead, and whoever owns CRM hygiene. Lock the opportunity definition, the deal-size source, the win-rate denominator, and the cycle-length start date. Then build the spreadsheet or dashboard so everyone sees the same number.
Days 31 to 60
Pick one lever and improve it deliberately. Tighten lead handoff if opportunity volume is the bottleneck, repackage offers if deal size is the issue, run a win-loss review if conversion is weak, or remove approval delays if cycle length is dragging. Don't try to fix all four at once unless you enjoy guessing what worked.
Days 61 to 90
For messaging-led teams, add the automation layer. Launch auto-welcome flows, route smart-link captures into the CRM, and tag source-attributed broadcasts so your team can see which conversations turn into revenue. Then review the metric monthly and ask the same question every time, which lever changed, and was it a real operational improvement or just a reporting artifact?
Quarterly self-audit: Are the opportunity rules still the same, is deal size based on closed-won reality, is win rate using the same time frame, is cycle length measured from the same start point, and is the dashboard split by the right segment?
If you want a team that helps turn pipeline data into real revenue motion, Double My Leads can give you the WhatsApp infrastructure to capture, route, and attribute conversations without adding more manual work. Visit Double My Leads if you're ready to build a cleaner funnel, tighten response speed, and make sales velocity something your team can manage week by week.


