
You're usually not losing money because the ads are bad. You're losing it because the report lands late, the numbers aren't lined up across tools, and someone makes a budget call on the wrong signal. Facebook Ads reporting only works when it behaves like a decision system, not a screenshot archive.
That's the standard operators need in 2026. The useful report doesn't just summarize spend, it tells you what to keep, what to pause, what to investigate, and when the data is mature enough to trust. Meta's own reporting foundations still revolve around results, reach, impressions, cost per result, and spend, which is a good reminder that clean reporting starts with a small set of core signals, not a bloated dashboard (Meta business help).
Table of Contents
- Why Most Facebook Ads Reports Fail Before They Start
- The KPI Stack That Drives Decisions
- Building Custom Reports and Dashboards That Save You Hours
- Measurement Latency and Why Real-Time Reporting Misleads You
- Attribution, UTMs and the Conversions API Setup That Holds It Together
- Wiring Ads Data Into CRMs and WhatsApp Without Losing the Lead
- What Standard Reports Hide and How to Audit Delivery
Why Most Facebook Ads Reports Fail Before They Start
A Monday report goes out polished and neatly branded. The client spots one weak number in the top row, asks for an explanation, and by Wednesday the budget is paused even though the campaign was still in its learning phase and the signal had not settled yet. That is how strong accounts get treated like weak ones, not because the media is broken, but because the reporting layer turned a judgment call into a panic.
The failure usually starts before the dashboard exists. Many teams build reports around whatever the platform makes easy to display, then assume the report is finished because it has charts, colors, and a branded cover slide. That does not make it decision-grade. A report only matters if it answers a specific question at the moment someone needs to act.
Practical rule: if a report cannot change a spend decision, a creative decision, or an attribution decision, it is just decoration.
The better way to treat Facebook Ads reporting is as a control system. The data has to show whether pacing is on track, whether efficiency is improving, whether the campaign is producing real downstream value, and whether the numbers are mature enough to trust. Reporting governance best practices help teams set those rules before the first client review, and reporting governance best practices are worth studying before anyone builds another dashboard.
A strong reporting system also has to reduce argument. Internal teams, clients, media buyers, and CRM owners all need one source of truth, one naming logic, and one timing rule for when data becomes actionable. Without that, every meeting turns into a debate about which number is right instead of what decision comes next.
It also needs to respect measurement latency. A fresh lead count can look clean while the CRM is still catching up, and a conversion that arrived today may belong to a click from days earlier. That gap matters because Meta reporting, CRM records, and WhatsApp conversations do not update on the same clock, so the report has to show what is current, what is delayed, and what is still in motion.
Delivery bias creates another blind spot. If the report only highlights the easy-to-read top line, teams miss how placement, creative rotation, audience saturation, and lead quality are shaping the outcome underneath. The best operators wire Facebook Ads data into WhatsApp and CRM workflows so a lead becomes a conversation, then a conversation becomes a sales record, instead of staying a row in a spreadsheet.
The outcome is not a prettier deck. It is a cleaner operating rhythm, where the report triggers the right response at the right time, and nobody mistakes a fresh but unstable number for the final answer.
The KPI Stack That Drives Decisions
The weakest Facebook Ads reports try to surface everything at once. That produces clutter, not decisions. A better report uses a four-tier KPI stack, where each layer answers a different question and only the top layer gets client-facing emphasis.
Start with the foundation metrics Meta already prioritizes
Meta's core reporting view centers on results, reach, impressions, cost per result, and spend (Meta business help). That base matters because it separates delivery from efficiency. Reach shows how many people saw the ad at least once, while impressions count every time the ad appeared, including repeat views from the same person. Cost per result is spend divided by results, which is why many operators check it first when they are evaluating leads, sales, or app actions.
A useful report stacks metrics in this order:
- Tier 1, Spend Velocity: Is the account pacing correctly?
- Tier 2, Efficiency: Are CPA, CPM, and CTR moving in the right direction?
- Tier 3, Conversion Quality: Are ROAS, MER, and conversion rate showing real business value?
- Tier 4, Compounding Signals: Are cohort ROAS, LTV:CAC, and creative fatigue showing what is likely to happen next?
That structure keeps the first read simple. In most client reviews, the opening row should show spend, cost per result, and either results or ROAS, depending on whether the account is lead-gen or revenue-led. The rest of the report should support that call.
Use benchmarks as a sanity check, not a target
Independent industry reporting has made Facebook Ads numbers easier to compare across accounts. One 2024 roundup cites an average U.S. CPM of $4.29, an average Facebook CTR of 0.90%, and an average CPA of $18.68 across industries (Harmukh Technologies). Those figures are useful as a reference point, especially when a client wants to know whether a campaign is behaving normally.
They are not numbers to chase blindly. A narrow niche, a premium offer, or a cold audience will look different from a broad e-commerce account. The point is to know when an account is far enough off pattern to deserve a closer look.
A good reporting stack also needs to answer what happens after the lead lands. That is where digna dashboard best practices matter, because the cleanest media report still falls short if sales, CRM, and WhatsApp follow-up are not wired into the same decision flow.
The report should answer one question first. Is this account healthy enough to scale, or does it need intervention before more budget goes in?
Building Custom Reports and Dashboards That Save You Hours
Ads Manager already gives you enough to build a serious reporting layer if you're disciplined about what belongs where. The trick is to stop treating every dashboard like a full history of the account and instead create a few reusable views that match actual decision meetings.
Separate the executive view from the operator view
The executive view should be short. It needs the account's spend, key result metric, and one efficiency signal that tells the room whether the campaign is improving or slipping. If the campaign sells leads, that usually means cost per result and results. If it sells revenue, that often means ROAS and spend. The goal is to make the first read obvious.
The operator view should be deeper. That's where you add breakdowns by placement, device, creative, audience segment, and time. This is the view media buyers use to answer specific questions like whether one creative is carrying the account or whether a placement is spending without converting. The more granular the account, the more valuable saved filters become.
Make saved reports and exports do the repetitive work
Inside Ads Manager, saved reports, custom columns, and breakdowns are what save hours in weekly reporting. Once the column order is stable, you stop rebuilding the same table every Monday. Scheduled email and CSV exports are the next layer, especially when finance, sales, or a client wants the same numbers without logging in.
If your team works across multiple accounts, a lightweight external dashboard can help consolidate views, but only if the naming is strict and the source is clear. Digna's dashboard best practices are a useful reference point here because data quality problems usually start with inconsistent labels, not bad charts.
- Use one naming convention: keep campaign, ad set, and creative labels readable so exported files don't become mystery spreadsheets.
- Version the report: if you change a metric definition, note it in the dashboard name or the sheet tab.
- Assign one owner: every client should have one canonical report, even if several people consume it.
The cleanest agencies don't build more dashboards. They build fewer dashboards that everyone trusts.
Measurement Latency and Why Real-Time Reporting Misleads You
The most dangerous phrase in Facebook Ads reporting is “the numbers just updated.” Fresh doesn't mean final. Meta says reporting can be delayed up to three days, and practitioners still recommend waiting 7 to 10 days before judging conversion performance (Meta reporting delay discussion). That gap matters more now because privacy changes reduced visible conversion signals and pushed advertisers toward Aggregated Event Measurement and the Conversions API.
Treat the first 72 hours as provisional
A lot of teams overcorrect inside a 24 to 72 hour window. They see weak early conversions, shut off a creative, and never let the account reach a stable read. That's a reporting mistake, not just a media mistake. Early performance can be incomplete, especially when conversion paths include delayed actions, cross-device behavior, or weaker browser-side signal.
The simple fix is to label every report with a decision-grade date. If today's dashboard is being used for optimization, note the date range, the expected delay, and the point at which the report is mature enough to support a spend decision. Weekly and monthly cadences work better than constant refreshes because they force the team to review settled data, not live noise.
Build review rhythm around data maturity
A weekly report should focus on directional changes and account health. A monthly report should focus on what changed, why it changed, and what the next budget move should be. A daily refresh is still useful for pacing, but it shouldn't be treated as the final word on conversion quality.
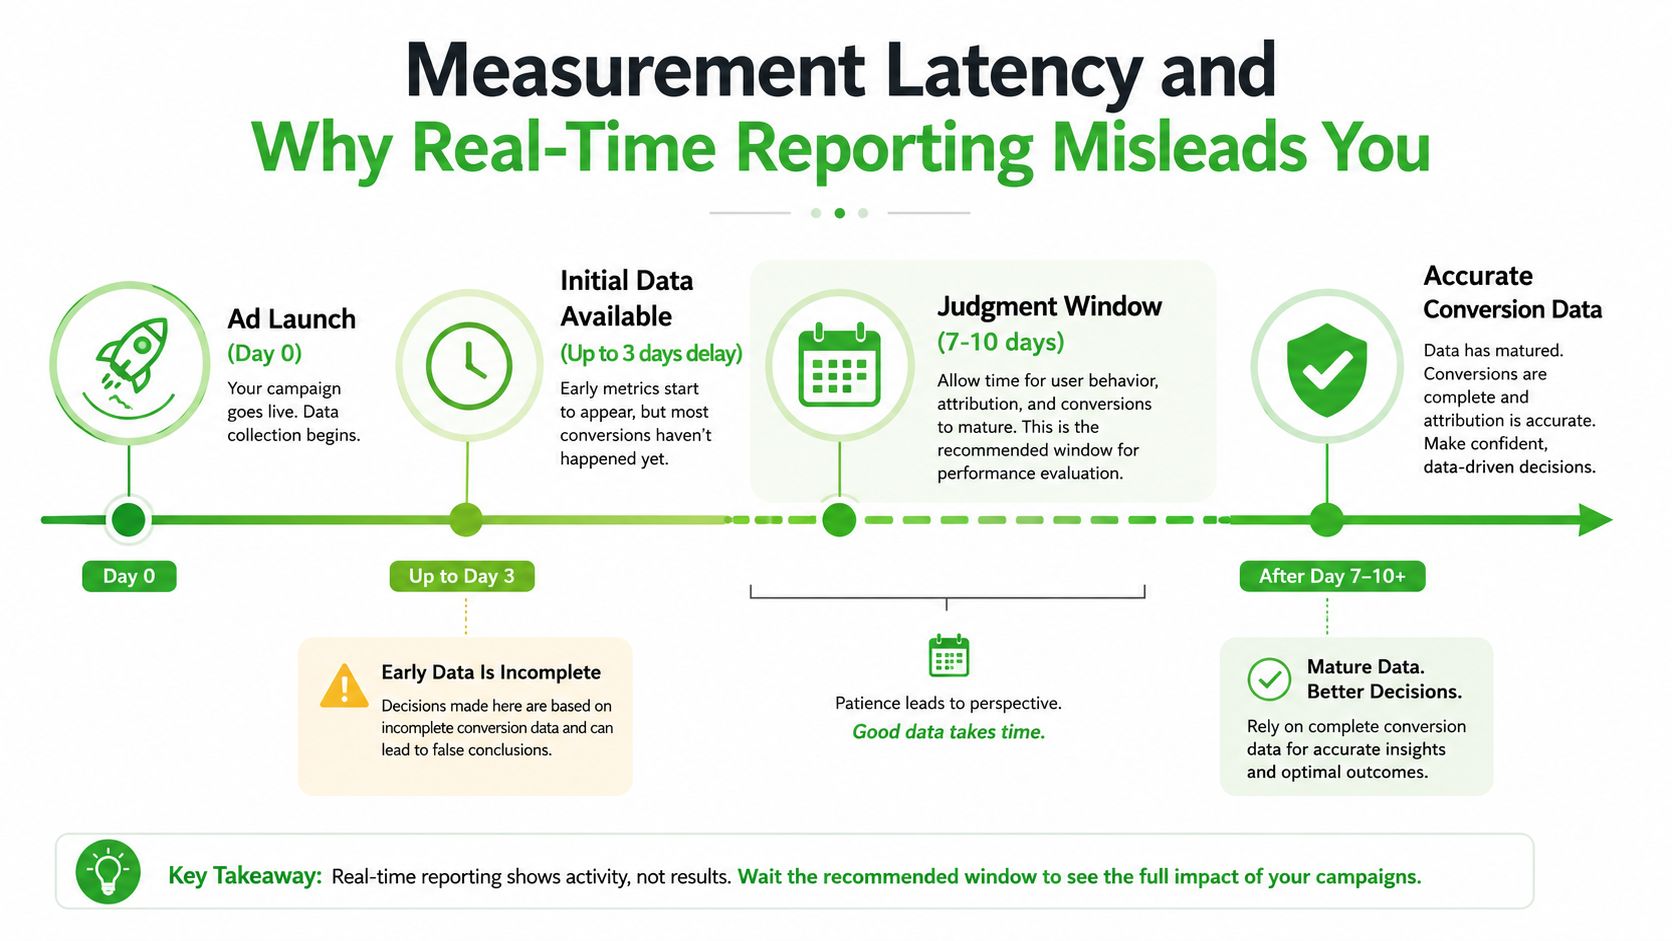
If you make decisions before the data settles, you're optimizing to the dashboard, not to the business outcome.
Attribution, UTMs and the Conversions API Setup That Holds It Together
Reporting falls apart fast when tracking is sloppy. The ad platform may still show impressions and clicks, but once the click path, campaign name, and conversion event don't line up, the report becomes hard to trust. That's why attribution hygiene is part of reporting, not a separate technical chore.
Keep UTM structure simple and readable
A good UTM pattern should tell you where the traffic came from and how it was structured in the account. A practical convention looks like this:
| Parameter | Purpose | Example Value |
|---|---|---|
| utm_source | Traffic source | |
| utm_medium | Channel type | paid |
| utm_campaign | Campaign name | spring_lead_gen |
| utm_content | Creative identifier | video_a |
| utm_term | Optional audience or ad set label | broad_us |
The important part is consistency. If one campaign says “FB” and another says “facebook,” your reporting layer has to normalize those values later. That's wasted time and avoidable error.
Add a weekly QA routine for tracking hygiene
Every week, spot-check live ads for broken UTMs, redirect issues, and duplicate conversions. HubSpot's Facebook Ads tracking guidance makes the practical warning clear, tracked URLs need to be full URLs, not shortened links, and they shouldn't redirect if you want parameters preserved (HubSpot tracking guidance). That matters because a broken link can make a campaign look like it's underperforming when the actual problem is the tracking path.
The Conversions API belongs in this same checklist. Server-side events help recover signal that browser tracking misses, and deduping browser and server events protects your report from double-counting. In practice, that means the tracking system should be checked before the dashboard is ever discussed.
A reliable report starts with clean input, not clever visualization.
Wiring Ads Data Into CRMs and WhatsApp Without Losing the Lead
The report gets much more valuable when it stops at the ad platform and starts following the lead into the CRM and conversation layer. A click is not revenue. It's the beginning of a handoff, and every handoff needs source data attached to it or the reporting trail breaks.
Move source attribution from the ad to the contact record
The first job is simple, keep the campaign name, source, and ad set or creative reference attached to the CRM lead. HubSpot's ads tools show how connected ad accounts can sync impressions, clicks, and new contacts into the CRM, and how ad reports can be filtered by account, date range, and attribution model (HubSpot ads analysis). That's the model to emulate even if you use a different CRM. The lead record should know where it came from before sales ever touches it.
Once that attribution exists, WhatsApp can become the next measurable step. A welcome flow, assignment rule, or tag should be triggered by the same campaign source that created the lead. That way, the report can show not only how many leads arrived, but how many became conversations and how many conversations turned into pipeline.
Use the same source logic in broadcast and conversation tools
Reporting often gets thin. Teams celebrate campaign traffic, but they never connect that traffic to who replied, who stayed active, or which message path created the best downstream response. If you're using social data to enrich lead flows or segment engagement, top social scraping tools can help with source discovery and enrichment, but the reporting standard still has to be the same, one source field, one contact record, one conversation thread.
The useful workflow is ad click, UTM, CRM record, WhatsApp conversation, closed deal. If any field drops out, attribution starts to blur.
For agencies, this matters even more when WhatsApp is part of the white-labeled offer. A broadcast metric without CRM participant sync is only a delivery stat. Once source attribution follows the contact into the inbox, you can tie message response back to the campaign that generated it.
What Standard Reports Hide and How to Audit Delivery
A good CPA can still mask a weak delivery pattern. A decent ROAS can hide a saturated audience. A dashboard that only reports efficiency gives an incomplete picture, because Meta delivery can skew outcomes even when targeting settings look neutral. Academic research found that Facebook ad delivery can produce uneven outcomes along gender and racial lines in housing and employment ads, so standard performance reporting can miss distributional problems unless demographic breakdowns are part of the audit (arXiv research).
Audit who the ads are reaching
That does not mean every account has a fairness issue. It means the report should answer more than “did it work.” If delivery concentrates in a narrow segment while the campaign is meant to stay broad, the account may look healthy on paper while underserving parts of the intended audience. Demographic breakdowns matter for efficiency-focused advertisers too, because they show whether spend is reaching the audience the plan was built for.
Creative-level reporting helps here as well. If one ad is carrying nearly all the volume, the account may look stable while the creative pool is already wearing out. Industry guidance often flags frequency above roughly 3 to 4 for cold audiences as a sign of fatigue. That is not a universal cutoff, but it is a useful signal that the same people may be seeing the same message too often.
Run a weekly, monthly, and quarterly rhythm
A Monday operator review should focus on creative-level cuts, frequency, and spend pacing. That is where you decide whether to refresh creative, move budget, or hold steady. The monthly client narrative should be more strategic, covering what changed, what the account taught you, and what action comes next.
The quarterly review should zoom out to cohort ROAS, longer-term value signals, and channel mix. That is where you stop judging the account by last-click velocity alone and start asking whether the system is producing durable revenue.
- Weekly operator check: review creative winners, frequency, and pacing.
- Monthly client review: explain what shifted and what you are changing next.
- Quarterly strategy review: connect cohorts, value, and channel balance.
A mature Facebook Ads reporting system does not just show outcomes. It audits delivery, tracks fatigue, and keeps the team from confusing a narrow win with a healthy account.


